
We start with outlining what the milestones to become data-driven are for businesses, based on our Devoteam expertise within this field.
Milestones towards becoming a data-driven company
The milestones each company must pass on its way to becoming data-driven are outlined below, alongside which Looker product can help at each stage. We’ll expand upon each milestone and Looker solution later in this article.
1. Start generating and collecting data + set up data foundations with Looker Studio
A data-driven company starts collecting data, implementing tools and services. They then set up foundations: preparing the data, a data operating model, setting governance etc. and start to use the data to make decisions.
Looker Studio is the Looker product that can help at this stage.
2. Using data for decisions and good explanations with Looker Studio
Milestone one is done by other methods than simply the gut or instincts of people within the company, and to seek out good explanations on why business critical events happened.
These explanations can help influence future decisions, and is where human beings can be creative. Once you start relying on these decisions and explanations, you may experience pushback or doubt on those conclusions.
Looker Studio is the Looker product that can again help here.
3. Creating trusted data sources with Looker Studio Pro
How can you demonstrate trust in your data? It may require you going back and modifying your data collection, switching vendors or showing your data lineage to back up the data’s claims. Should adoption be gained, as more people use the data, then milestone four is around the corner.
Looker Studio Pro is the product that is adequate to help with this milestone.
4. Data Governance access and consolidation with Looker Studio Pro and Looker Enterprise
This milestone is all about user governance and data quality issues that will start to become more important. Who and what they are doing to the data will be more business critical.
Once you have a proper data governance structure in place, then you can look to take some of the insights and explanations from your dashboards and use them in more scenarios than dashboards.
Looker Studio Pro and Looker Enterprise can help with this milestone.
5. Data Activation channels beyond dashboards with Looker Enterprise and Looker Studio Pro
Not needing to rely on a person to react but to have automatic APIs or data workflows setup and triggered by set conditions. As you turn your data into information and wisdom, more advanced mechanisms to extract information from your raw data may be needed. That’s where the next milestone comes in.
Looker Studio Pro and Looker Enterprise can help with the data activation beyond dashboards.
6. Introduce more sophisticated data modelling with Looker Enterprise
To extract information from your raw data, ML and statistics may be required prompting using data science platforms. Using these models in an effective manner will require the whole organisation to embrace the data.
Looker Enterprise is the Looker product that can help with the more sophisticated data modelling.
7. Experimentation and a data culture
A data culture of experimentation and using data as a 1st class citizen may need to be infused across the whole company, requiring change management and training throughout the organisation.
We’ll now have a look at the Looker products in more detail, and demonstrate how they can help to solve for each of these milestones.
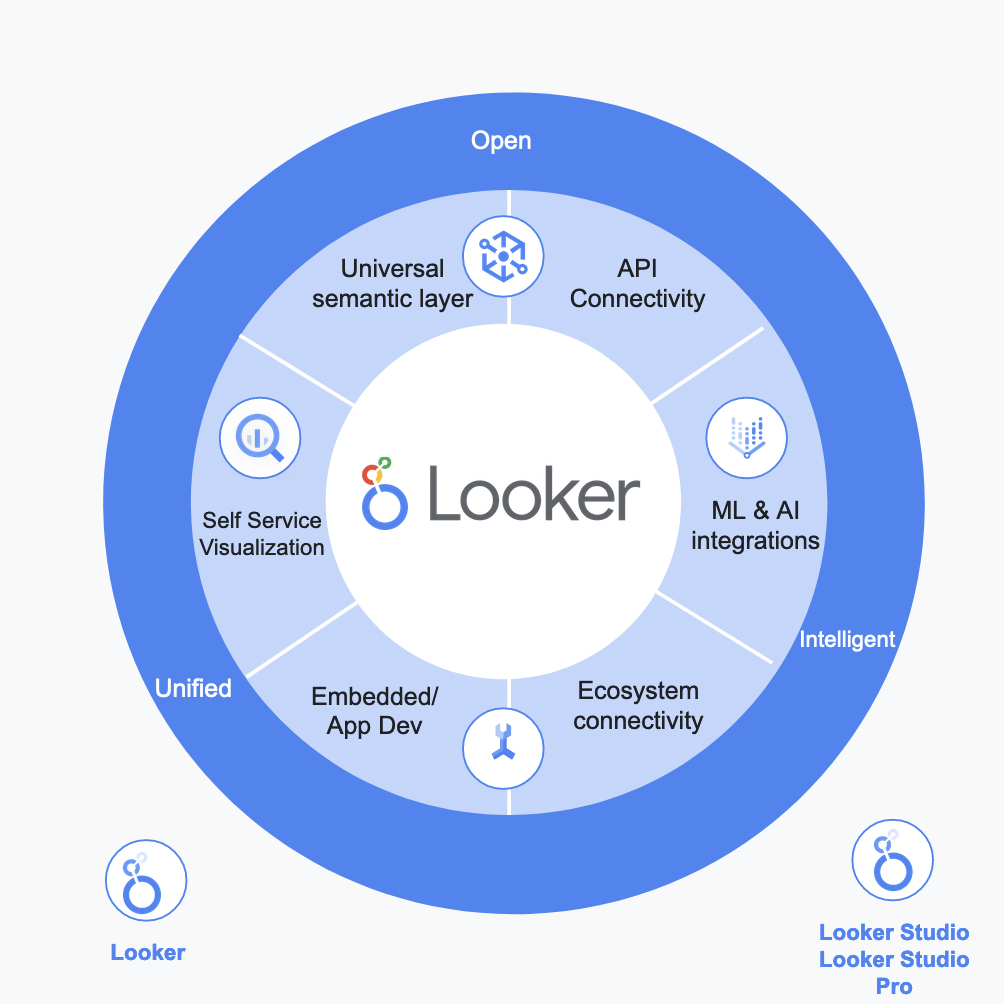
2. Introduction to the Looker suite
Looker now encompasses a lot more than the cutting edge BI company Google bought in 2020. Google has had its own data visualisation tool called Data Studio that started within the Google Marketing Suite, for visualisations of Google Analytics and other digital marketing data. It quickly expanded to include data sources such as BigQuery, Google Sheets and other non-Google sources, enabled by its open protocol for creating new connectors and visualisations.
For many years Data Studio was a popular choice for data visualisation tasks within an organisation; in particular for its ease of use, free price point, data connectivity and being able to share with others via a URL. At Google Cloud Next 2022, Google announced that Data Studio was being rebranded to Looker Studio, alongside the introduction of a new paid service Looker Studio Pro.
In total then, there are three products to choose from the Looker suite: the original Looker (we shall dub Looker Enterprise in this article to avoid confusion); Looker Studio Pro and Looker Studio.
Discover a comparison of these products below:
Looker Studio
- Dashboarding and analysis tool
- No new features (yet)
- Free, web based
- 7+ million users
- Data sources: Excel, CSV, Google Sheets, Google Analytics, BigQuery + hundreds of custom connectors
Relating Looker Studio back to the milestones mentioned above, Looker Studio is an excellent first stop for when you have (1) collected your raw data and are looking to (2) explore and make decisions based on that data.
Connect multiple data sources
It connects to a multitude of data sources including a local Excel or Google Sheets file so you can get started quickly, and it comes with several pre-existing templates. However, as your organisation grows you may find that as people use Looker Studio more you may run into issues such as who owns your data sources or dashboards.
Data sources and the decisions you make based on them may start to be challenged. At this point, you may start to consider Looker Studio Pro.
Looker Studio Pro
- Looker Studio + data governance features
- $7 per active user per month
- Share dashboards with a team, not individuals
- Orgs own dashboards not individuals
- Integration with Google Dataplex
- Integration with Looker Enterprise
- 99.9% SLA
Looker Studio Pro is a new offering in 2022 that gives businesses more control over the Looker Studio product. For a fee, you can start to tackle the milestones of trusting your data (3) and working on data governance (4), namely who can see what data in your organisation.
Looker Studio Pro also introduces an SLA, so you can trust your data availability. Looker Studio Pro integrates more tightly with Google Cloud via its identity management (IAM) offering the same level of fine level control as other GCP services, and includes Looker Studio Pro dashboards and data sources within its Dataplex product.
Data governance
Dataplex is a full-fledged data governance tool across GCP and beyond, and lets you for example see the consequences to downstream dashboards if you delete or change an intermediary table.
Looker Studio Pro won’t however let you control how people use your data, and you may stand the risk of various stakeholders defining different “sources of truth” with the same data. You also may become frustrated that although the right data is being made available to your colleagues, it is not impacting your business as they are not reacting to the data they are looking at.
At this stage, you may be ready to look at Looker (Enterprise), which has features such as the semantic layer and data application services you may now be ready for.
Looker Enterprise
- Data Activation tool with BI, APIs, data apps and semantic layer
- Stores no data – “looks” into your data sources
- LookML – standardise data naming conventions and business logic for downstream sharing
- Sits on top of data warehouse inc. Google Cloud, AWS, Azure etc
- Creation of data applications with auto authentication flows, mobile apps, real-time data processing
Looker Enterprise offers its own visualisation options within it via its Looks, Explores and Dashboards. However, several companies use it solely for its semantic layer and data activation capabilities, choosing another visualisation tool such as PowerBI or Tableau to send Looker’s data. Looker Studio essentially adds to that list of visualisation tools you can use with Looker.
An illustration of how the Looker products relate to one another is shown below.
More advanced data use cases with the Looker Enterprise Suite
The Looker Enterprise suite can help you with the more advanced use cases for data. Your data engineers can craft the business metrics your users will use in downstream data applications including Data Studio via its LookML language. You have fine grain control about how data is defined and to ensure everyone is applying the same business rules to your data.
You will also be able to create data applications beyond dashboards, and make your dashboards interactive e.g. A dashboard indicates a campaign is over performing – so the end user can press a button on the ashbord itself and increase the campaign budget without leaving its interface. This helps with the 4th and 5th milestones given above.
Once you are leveraging data well, you are in a good position to try and extract more information out of your data via machine learning solutions. Looker is able to interact with BigQueryML, a managed machine learning system created via SQL, for instance, but will also interface with all other popular machine learning pipelines and endpoints, covering your for the 6th milestone.
Creating a data culture
The 7th milestone, a data culture, is something that tools such as Looker alone will not help with. But once those tools are in place, you have a fertile ground to train and enable your colleagues to use your now considerable data capabilities, and foster a data experimentation culture to make best use of it.
We have talked about all the different products that lie within the Looker suite, showing what features they have and how they may help along your data journey.
We shall now deep dive into creating your semantic layer in Looker, where you can create your own data definitions for your business users to consume, without them needing to perform extensive data engineering.
Looker Enterprise – Where Business Logic meets the Data
The next section of this article introduces you to Looker Enterprise – the third and probably the most advanced and most exciting product of the Looker Suite. We will look deeper into the semantic layer of Looker: the part where the raw data from a datasource meets the business logic.
We will go through a simple example use-case of eCommerce website data, and see how this business logic can be modelled in LookML – Looker’s modelling language.
Looker Enterprise: a platform for enabling data experiences
Looker can be called a BI solution. However, one would also like to deviate from this definition and call it rather a platform for enabling data experiences. Looker can be compared to other similar solutions, such as PowerBI, Alteryx and Tableau.
However, it has its own advantages, which make it one of the best choices in some of the most common data analytics challenges one could have.
The next section introduces exactly what is so special about Looker: its semantic layer together with a simple use-case of how the semantic layer could be represented, or, in Looker terms, modelled.
Looker’s Semantic Layer & LookML
When talking about Looker, one special feature of it should take the first priority in discussions about why one should consider Looker. That is, its semantic layer.
Semantic Layer is an abstraction that sits between a datasource and the presentation layer, which Looker also has of its own, however is not limited to. Semantic layer is built in LookML – Looker Modelling Language – and is specific to the business logic and business rules it should provide.
In more technical terms, Looker’s Semantic Layer is a collection of git-versioned LookML files, where each component of your data – a table, a column and an aggregation of a column value – is abstracted into a collection, or a single file.
Explores in Looker
Besides the tables, dimensions (columns) and measures (aggregations), the semantic layer also includes Looker-specific model definitions, data access rules, dashboard definitions, and last, but not least, explores. An explore is another Looker concept, which one should be familiar with, if one is to build data analytics solutions in Looker or one is to explore the data as an end user.
An explore is an analytical representation of the relationships of your data, that is, an explore is built by joining your tables together in LookML code, where the introduced joins give a logical relationship of your data tables, which then can be explored – selected, recalculated, if needed, and then presented – for example, in Looker’s native dashboards and looks.
Example of a semantic Layer
Let’s have a look at an example. The below figure shows how a semantic layer could look like for a sample eCommerce use-case:
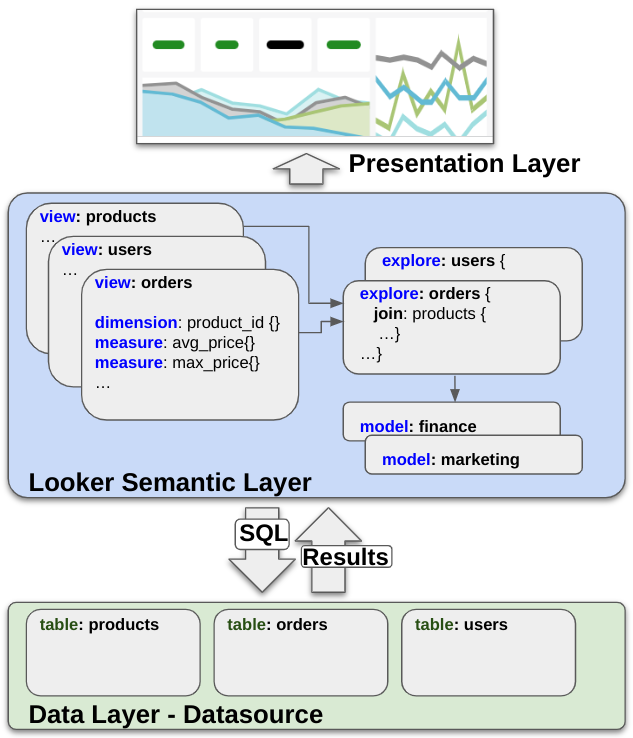
In the above figure, we have 3 tables in our datasource – products, orders and users. The datasource could be a SQL-based database, such as MySQL, Snowflake or BigQuery; it can also be a Google Sheets file. Before the data is presented in the presentation layer, the business logic is modelled in the semantic layer: in this case, we define the 3 tables (called views in Looker) with their corresponding columns, which are represented as dimensions and measures.
Then we define a couple of explores, which then are related to a number of models, that in this case may represent 2 departments – “finance” and “marketing”. Why would you have 2 separate models, represented by two different departments? The reason could be that different data should be accessed by different departments. We will not go into details regarding data access here, but it is also possible to model in the semantic layer.
What is also important to note in the above figure, is the relationship between the 3 layers – presentation layer, semantic layer and the data layer. From the semantic layer, Looker writes the most performant SQL to the datasource and retrieves the results back. And then, the semantic layer brings the results up to the presentation layer, where the looker dashboards, looks and explores are presented for the end user.
How Looker differs from other BI Tools
The current landscape of available BI tools and platforms in the market is quite diverse, however, also quite fragmented. Each technology is almost ready to provide the BI tool best fit for their use – Microsoft offers PowerBI and SAP platform has a corresponding Business Objects solution. And then there are other solutions which cover data analytics needs, however with different technological flavours: such as Alteryx and Tableau.
As mentioned before, Looker is strongest if one considers its semantic layer – and one should choose Looker, if that is where the weight of the decision lies. To add on top of it, the semantic layer is where the Looker roadmap is directed to. In the future, one will be able to develop the semantic layer of the business logic and business needs, and then use other solutions, such as PowerBI or Tableau, for their strong data visualisation capabilities.
Additionally, in other tools you need to create worksheets and write scripts to load data, but Looker allows the users to directly query the database. Any user without SQL knowledge can therefore query the company’s data thanks to this semantic layer.
Another advantage of Looker is that the tool is better at drilling down. In other tools, data engineers might use some aggregations so that data is not too large, but in Looker you can always drill down to see what’s inside the data.
Looker as a BI Solution – Lessons Learned
At Devoteam, we have implemented or helped implement a number of projects that were focused on Looker as a data analytics platform. The companies embracing Looker made the right choice – their use-cases were quite broad in terms of where in the company the analytics had to be consumed.
They were also quite democratic technology-wise, and they were mature in their journey of becoming data-driven companies. So the fundamental need of data analytics for better business decision making in the company was already there and already being satisfied with quite well-established data analytics solutions.
The only remaining necessary component was the data technology they needed to choose going forward, either from the very start with no existing starting-point, or from the aspect of improvement, where the data analytics in question were implemented in more rigid solutions, such as for example Metabase.
Based on their use-cases, some themes appeared to be quite common for all of them – that is:
- Being able to present data real-time without considerable time delays
- Being able to provide a sufficient data access model in the data platform without implementing PII, user and group access directly in their original datasource
- Being able to provide a sufficient and easy to implement data consumption model, where self-service (which means, business users can explore their data to create their dashboards and reports) was a key element for the new data-platform success.
Last but not least, moving from SQL-based queries in the data analytics platform (such as Metabase) to a more comprehensive semantic layer, made the overall reporting solution much easier for the data team to consume, maintain and expand.
Other interesting use cases from the real world
Besides modelling eCommerce website analytics data, in this section we look into other business use cases, which Looker can help bring into easy to understand, easy to build, and easy to maintain analytics solutions.
User Conversion Funnel
For quite some business use-cases, it is crucial to know how the user conversion funnel for a website or an app looks like. A user Conversion Funnel can be explained as a flow which users go through while using an app or a website.
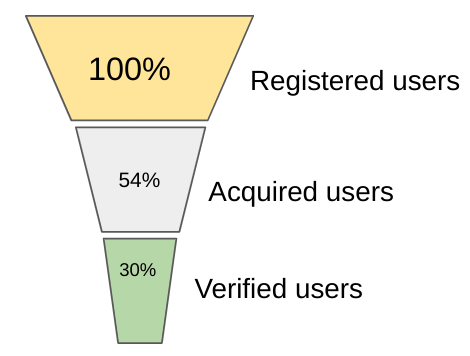
If we ignore the website/app visitors for a moment (those users, who visit the website and leave), we can look at the registered users, acquired users and verified users. Registered users would be those users that have registered on the website/app.
Acquired users would be those that have carried out a transaction/purchase on the website/app. And then verified users would be those that have performed n-th transaction/purchase on the website/app.
What is interesting to see from a marketing perspective, is what is the fraction of users that get acquired and converted. Based on the results, the company’s marketing department then can take specific actions to increase the fraction of the users that keep constantly making transactions on the website/app.
Top to Bottom Analysis of Marketing Metrics
Depending on what one is following in the data, such as top 20 countries with the most users, top 30 brands with the most sales or bottom 15 categories with the least average sale price; in Looker one can display these types of analyses visually in a very easy and consumable way.
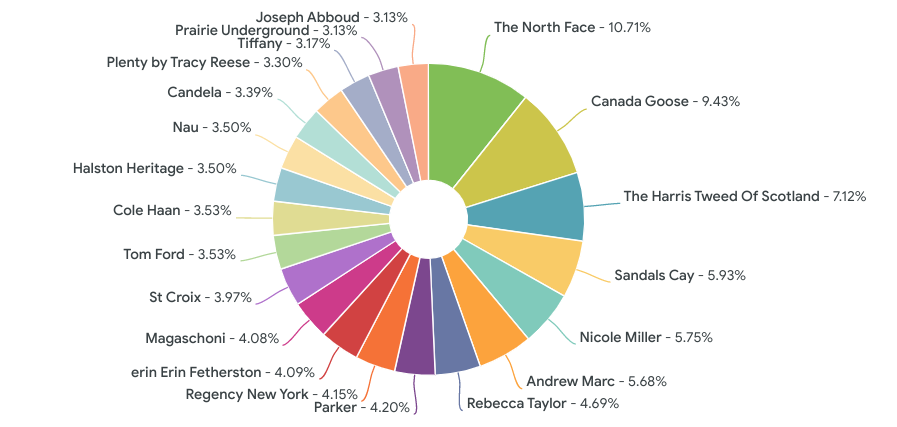
Looker would also take care of any displacement/change in the ranking of your data, therefore minimising the effort to keep visualisation up to date.
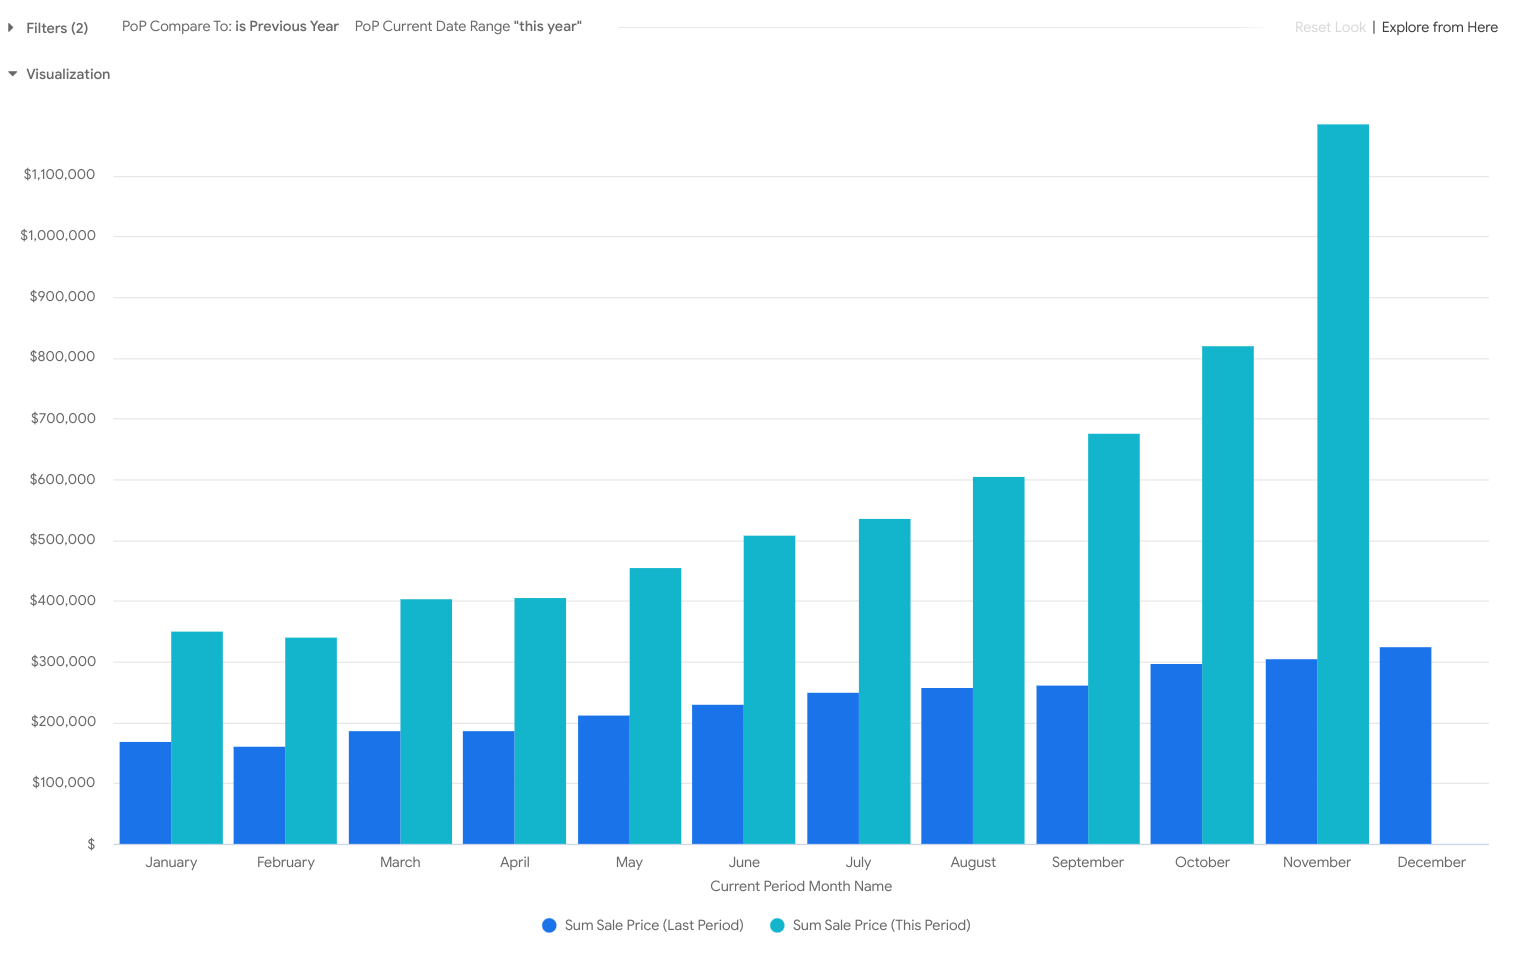
Comparing data of Two Different Periods
It is very common in any sort of analysis that one would like to compare data in different periods of time to one another, for example how many transactions have been created in this month, compared to the last month.
In Looker it is possible to implement period over period analysis, where one can compare different time periods that the data is represented in, therefore allowing one to save time by disregarding any complex spreadsheets one has for that purpose.
By allowing selection of different periods in the drop downs, in an instance Looker will show the comparison of the data.
Extra Resources
- Here is an inspirational video on what Looker could help you do from the recent announcements at Google Next 2022, which is a Google Cloud event that highlights new and exciting ways to use Google Cloud
- There are quite some good resources on the internet, which might help you along the journey with the Looker Suite. For period-over-period analysis in Looker, one of the best resources is this video.
Summary
Here, we have looked into Looker’s most advantageous feature, that is, its semantic layer, and how it can be modelled for a simple use-case. Besides this, Looker in short was compared to other BI solutions. And last, but not least, we demonstrated a few real-world use-cases, which can easily be modelled and presented in Looker. At this point, you should be able to recognise the value Looker could bring, and therefore you could consider it for your next data analytics project.

