Setting the stage
Nowadays, we live in a society where Big Data is becoming Big Business. Every device that’s up and running (e.g. your cell phone, the sensors of your manufacturing buildings, or your in-store tablets) generates a lot of data, which is (or is not) being used effectively to boost your business. The following of this blog will deal about one (final) aspect of utilizing all sources of data you have in your business: Visualization. Google just announced the availability of Data Studio, a dashboarding tool that’s easy-to-use and which I will discuss in the following of this blog. Bottom line of this application is that it will empower your employees at the business (non-technical) level to make decisions based on facts and not feelings by using the maximum data available at any time.
What’s Data Studio all about?
Data Studio is a relatively new product, which was announced at first to be part of the Google Analytics Suite. It’s a 100% free and globally available tool in which you can import data up to 2GB. 2 Gig is not much you’re thinking, right? Well, most of the time you’ll be linking or connecting your data to the tool, which is completely free (but more about that later). So now, what are the biggest advantages of Data Studio, and (not so unimportant) where will it stand with competitors like Tableau and Qlikview?
Fast visual designing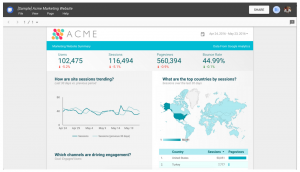
Data Studio allows to just drag&drop your charts onto the grid and easily resize it, presenting itself as a good solution to make beautiful reports. With this features, you also have lay-out templates on the homepage, so you’re ready to go, right away.
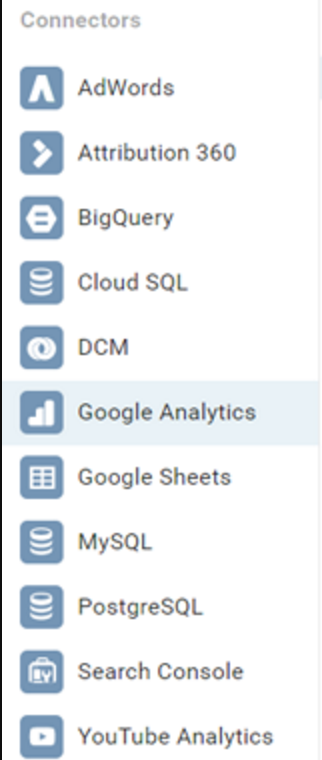 Easy to use with seamless integrations
You can connect Data Studio with your data sources coming from a Google Spreadsheet, BigQuery, Adwords, Google Analytics and even Youtube. When it comes to on-premise data, MySQL databases can also be connected right away, as well as uploading CSV files for free up to 2 GB.
Efficient as you can collaborate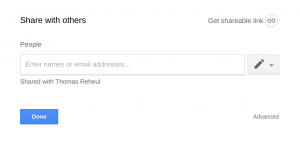
Data Studio borrows the sharing capabilities of Google Drive, which means you will have the same Look&Feel sharing a Data Studio Report as when
sharing a Google Doc. This means essentially that you can produce visual reports live with your colleagues, and the data updates automatically when it changes. So when your boss asks you to update a report during a meeting, you can just do it ad hoc, without making visualizations from scratch.
 It’s totally free
(Nothing more to be said…)
Conclusion
Data Studio is just a wonderful tool, that’s worth thinking about when you’re at the point of trying to combine all your data into one clear dashboard. Essentially this tool can give you the power to make simple reports (with no technical background needed) that generate faster insights so you as a business can act faster.
Employees can work together on the same report, so insights can be produced faster as well. Besides that, they have to capability to combine different data sources (like sales numbers from a sheet and client info originating from BigQuery).
As it’s a newborn product, don’t expect it to have the same amount of deep features like Tableau and Qlikview. But as the Google Product managers said: for 80% of the workforce, this tool can do everything they expect from a Data Visualization tool, and with more and more new enterprise features coming up, we can definitely say that Google is stepping up the enterprise tool offerings once more.
Go and explore on https://datastudio.google.com!
Written by Thomas Reheul
This post belongs to a series of blogs in response to Google’s yearly conference in San Francisco, March 8-10th. Stay tuned for more.

