Explore how to enhance Firestore debugging using Google Cloud Audit Logs and Log Analytics.
This article was written by Sijohn Mathew – Senior Cloud Architect in Devoteam G Cloud in Stockholm.
Introduction: Necessity of Traceability in Firestore
In this guide, we will explore enhancing Firestore debugging with Google Cloud Audit Logs and Log Analytics. Sit back and follow my 3 simple steps that will allow you to gain valuable insights into your application’s data access patterns.
But firstly, a few words about Firestore. As a developer, I appreciate Firestore’s scalability and user-friendly approach for rapid development. It’s ideal for real-time web/mobile apps dealing with large data. Yet, as apps expand and data grows, monitoring and debugging Firestore queries, and managing Pay-as-you-go costs, become more challenging.
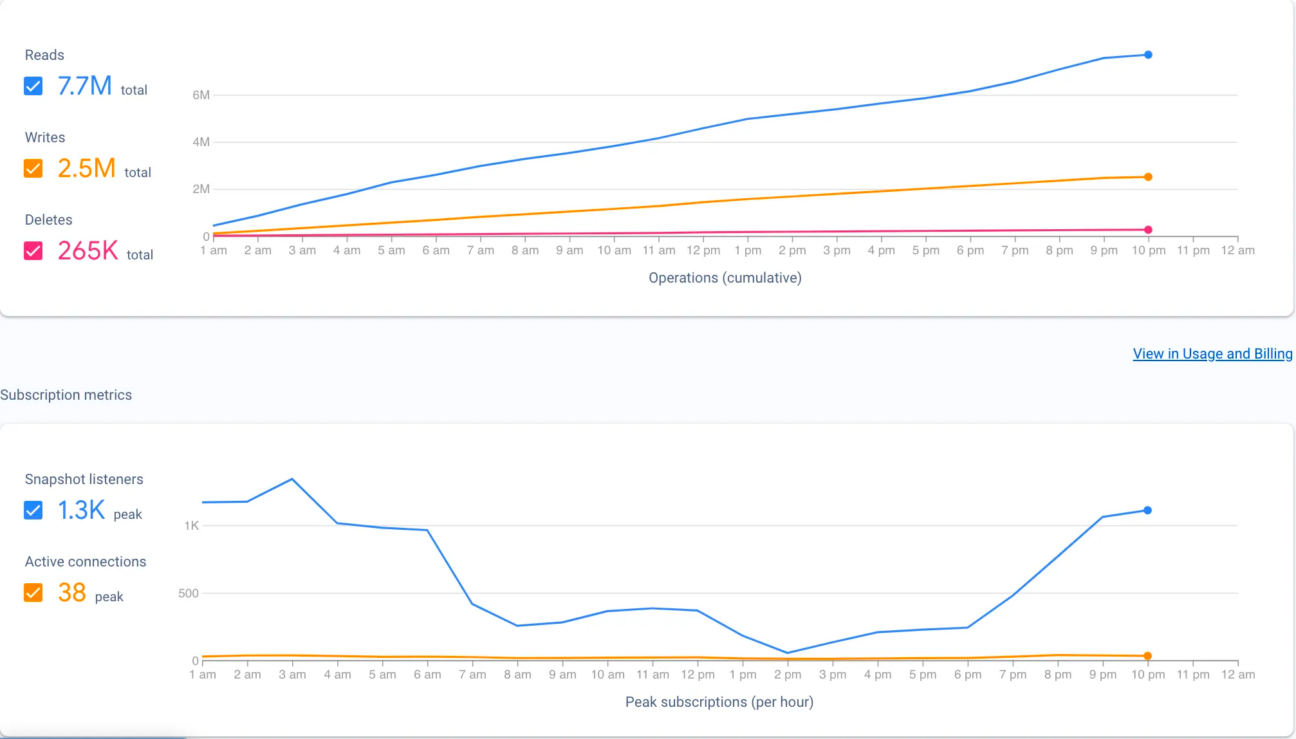
While Firebase Dashboard provides some basic monitoring tools to understand the daily usage patterns (see the picture below), they don’t offer direct insights into the origin of queries, and the collections or documents with which the queries interact etc, which can make troubleshooting performance issues and optimizing data access patterns a daunting task.
This is where Google Cloud Audit Logs and Log Analytics come in handy to address a few of these challenges.
Step 1: Enable Firestore Data Access Audit Logs
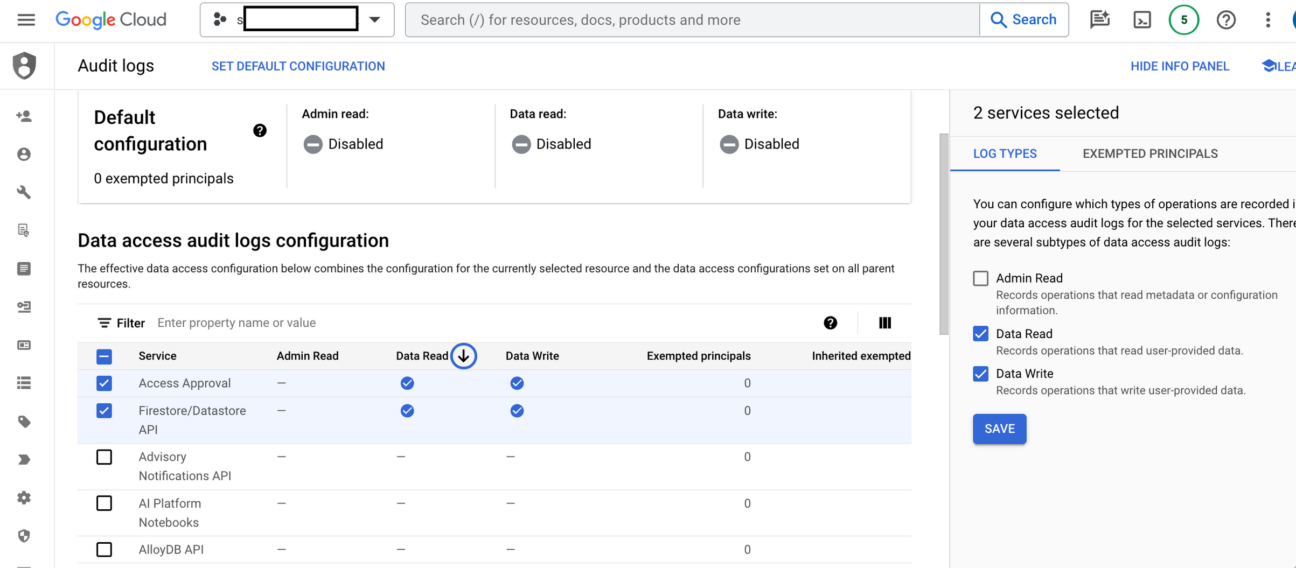
To start tracing Firestore queries, first enable Data Access Audit Logs in the Firebase console.
Navigate to IAM & Admin > Audit Logs. Find Access Approval & Firestore/Datastore API. Select Data Read & Data Write Log Types for both Service and Save. This will ensure that all Firestore read and write operations are recorded in audit logs.
Step 2: Create a Log Analytics Bucket
Log Analytics brings capabilities to search, aggregate, or transform logs at query time directly into Cloud Logging. It leverages the power of BigQuery to enable Cloud Logging users to perform Analytics on Log data.
Log Analytics is included in the standard Google Cloud Logging pricing. Queries submitted through the Log Analytics user interface do not incur any additional cost. Enabling analysis in BigQuery is optional and, if enabled, queries submitted against the BigQuery linked data set including Data Studio, Looker and via BigQuery API, incur the standard BigQuery query cost.
Navigate to Operations → Logging → Log Analytics
If are not already using Log Analytics, you get an option to “Create Log Bucket”
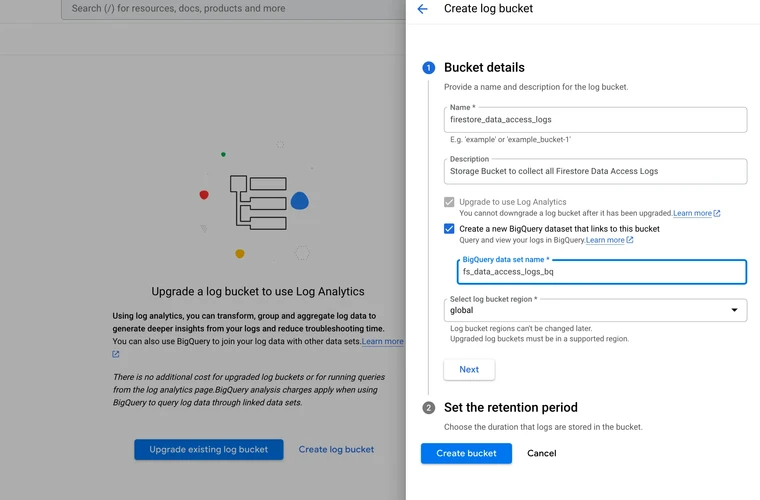
Set the Retention Period Eg: 5 days etc. Default is 30 Days
Optionally you can Create a BigQuery dataset that link to this bucket. This will help if you need to analyse the logs in the BigQuery SQL Studio.
After clicking the “Create Bucket”, you will be prompted to create a Sink. Follow the screens.
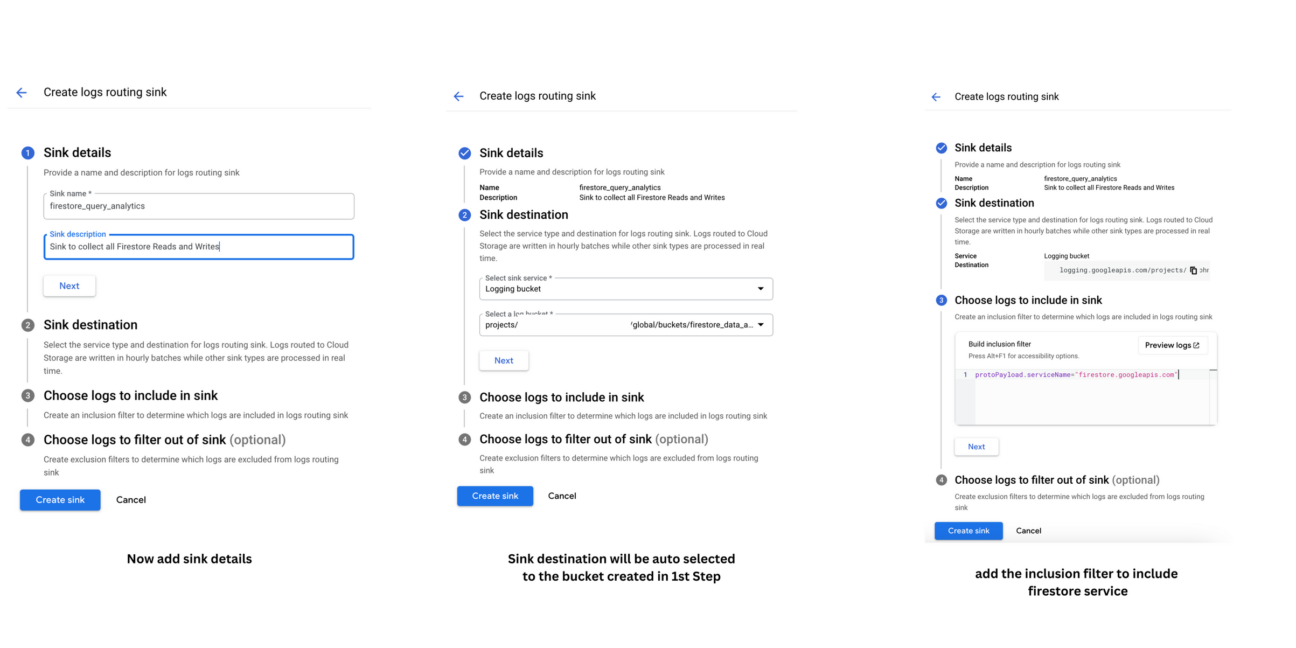
The key here is the Inclusion filter. Remember to add the below inclusion filter
protoPayload.serviceName="firestore.googleapis.com"Step 3: Analyze Logs Using Queries in Logs Explorer
With Firestore audit logs flowing into Log Analytics, you can now start analyzing them using queries in the Logs Explorer. The Logs Explorer provides a powerful SQL-like query language that allows you to filter and visualize log data.
Navigate to Log Analytics
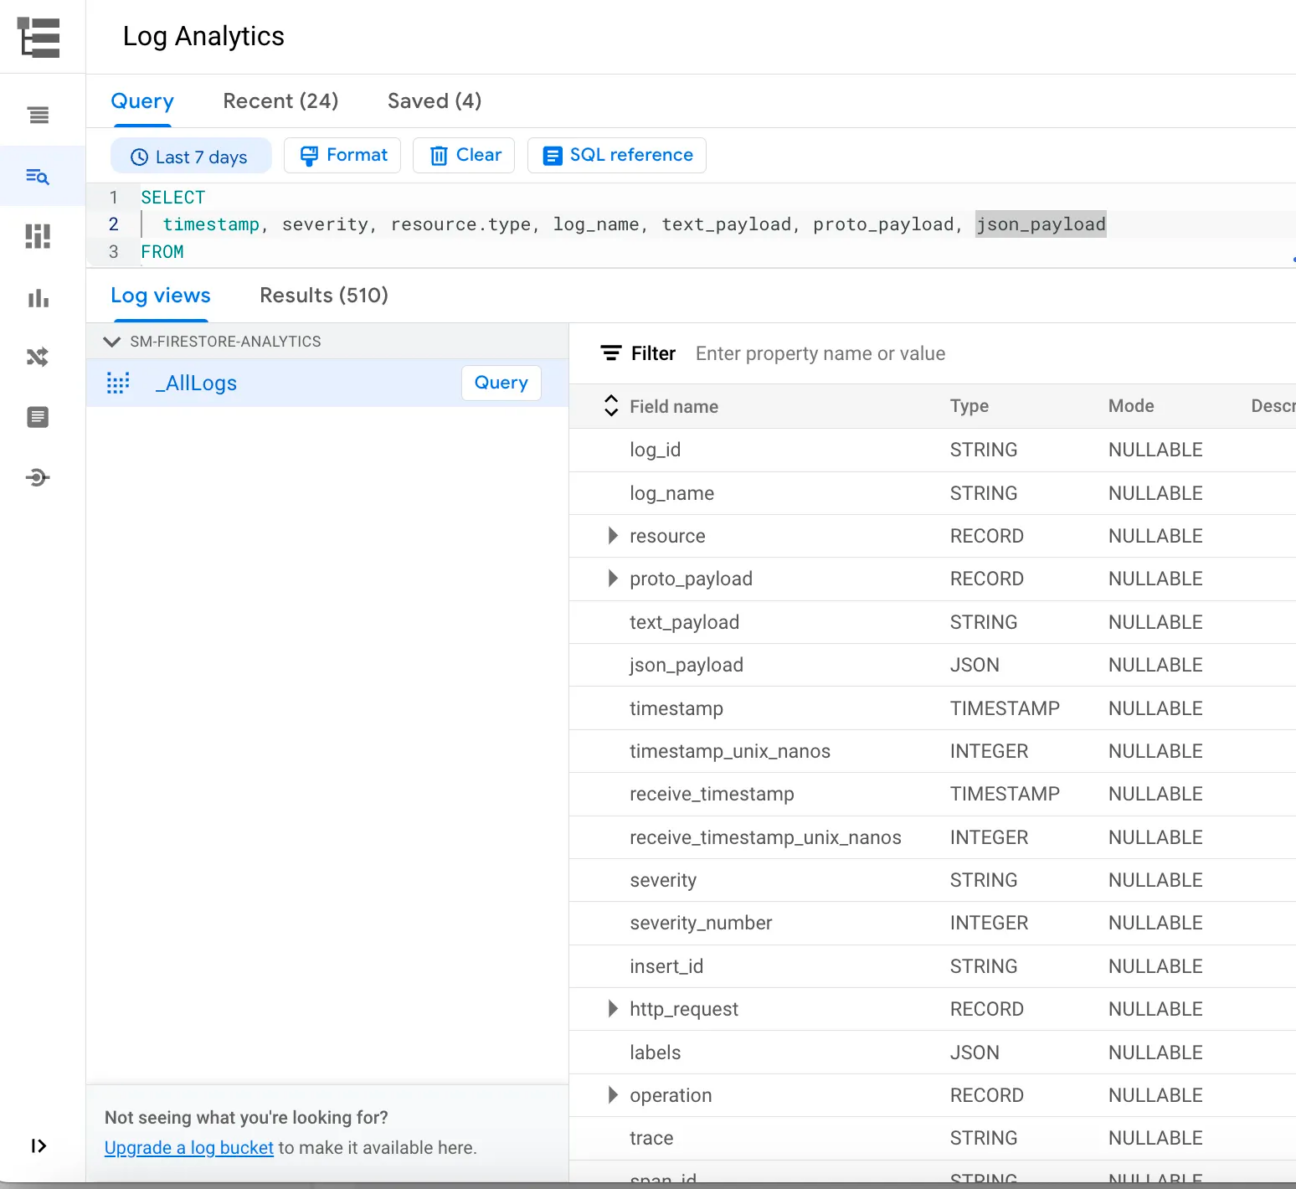
Explore the “proto_payload” attribute. This will give insights to many details on the Firestore DB usage.
Example queries in the Logs Explorer
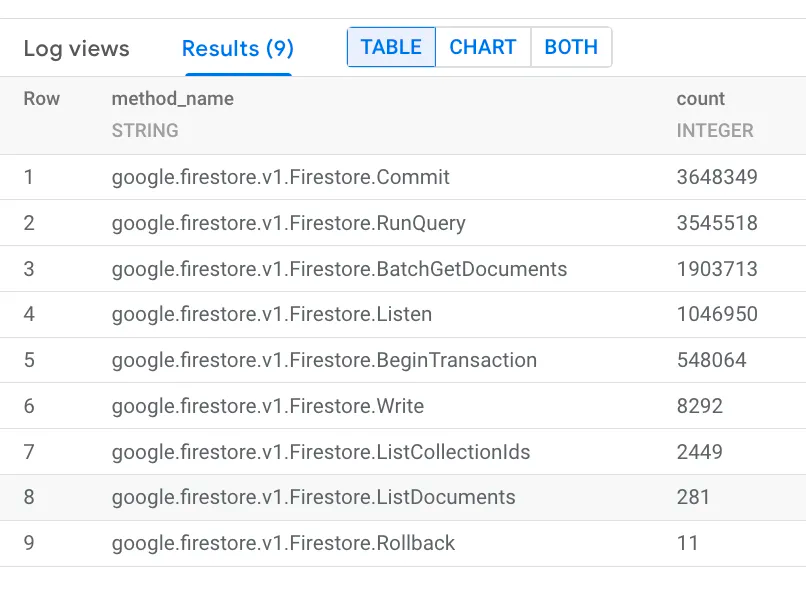
To find the most frequently used methods in Firestore API Calls:
SELECT
  DISTINCT proto_payload.audit_log.method_name as method_name, count(*) as count
FROM
  `<your-project-id>.global.firestore_query_analytics._AllLogs`
  group by method_name
  order by count desc
LIMIT 1000
Results:
Firestore: If a JSON Web Token (JWT) was used for third-party authentication, the thirdPartyPrincipal field includes the token’s header and payload. For example, audit logs for requests authenticated with Firebase Authentication include that request’s auth token.
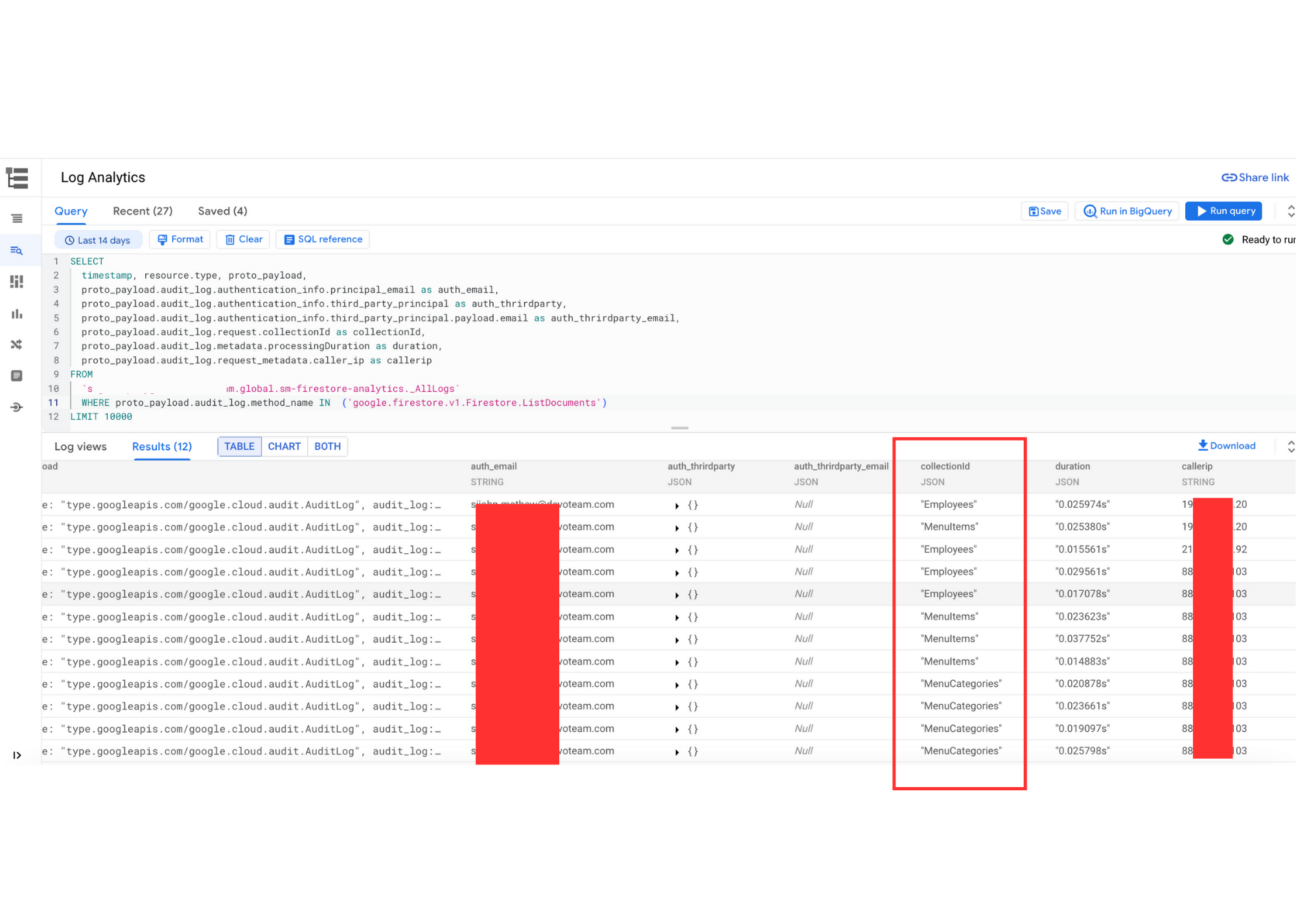
Sample Query to list and extract details from the proto_payload:
SELECT
  timestamp, resource.type, proto_payload,
  proto_payload.audit_log.authentication_info.principal_email as auth_email,
  proto_payload.audit_log.authentication_info.third_party_principal as auth_thrirdparty,
  proto_payload.audit_log.authentication_info.third_party_principal.payload.email as auth_thrirdparty_email,
  proto_payload.audit_log.request.collectionId as collectionId,
  proto_payload.audit_log.metadata.processingDuration as duration,
  proto_payload.audit_log.request_metadata.caller_ip as callerip
FROM
  `<your-project-id>.global.firestore_query_analytics._AllLogs`
  WHERE proto_payload.audit_log.method_name IN
          ('google.firestore.v1.Firestore.Listen')
LIMIT 10000
Finding Collections that are accessed from different IP’s by user ids by the ListDocuments API:
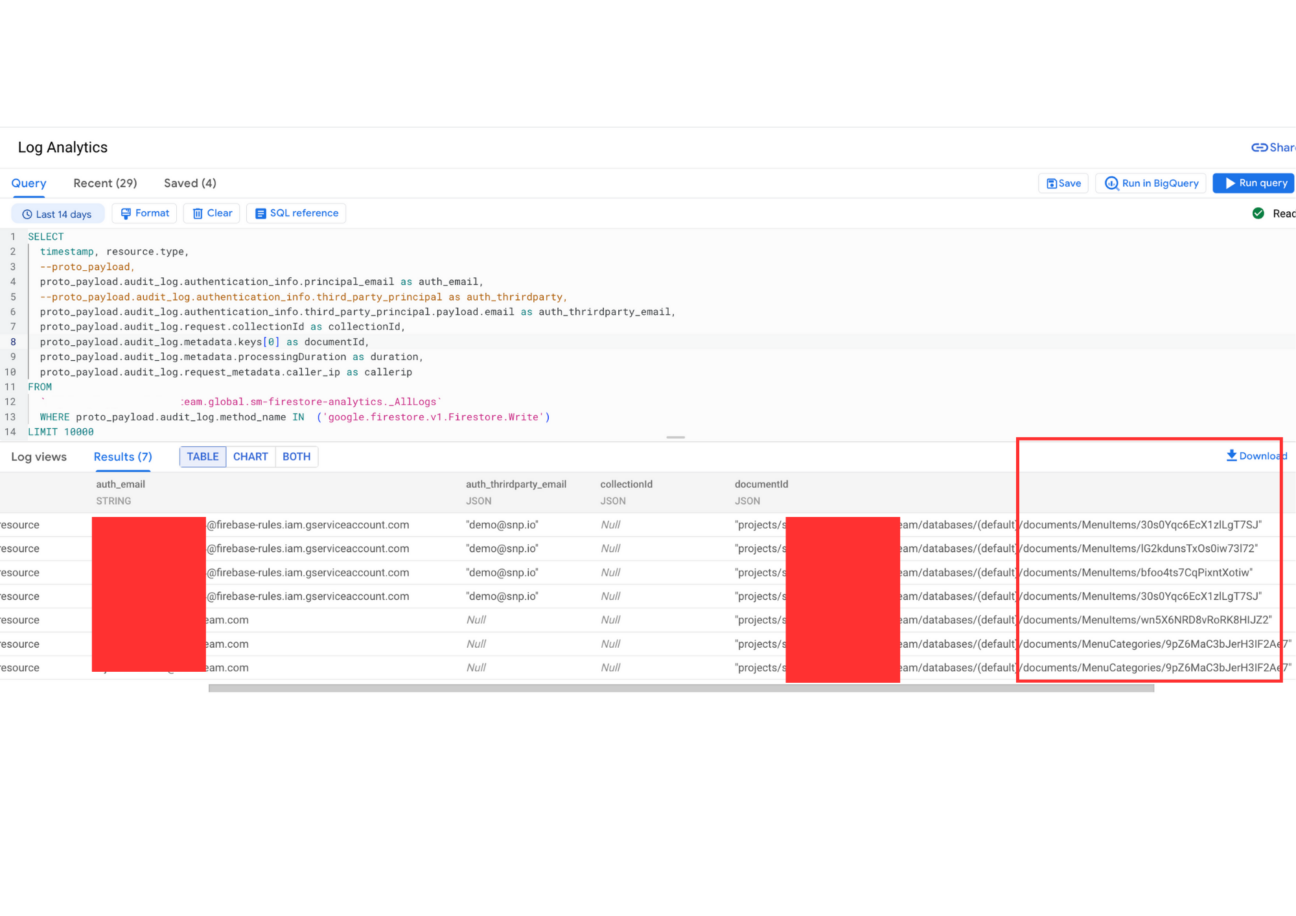
Finding Documents which are accessed by Write API users (categorized principal email & JWT token):
Extra Firestore Tips & Tricks
Analysing Log Data in BigQuery : If you are more comfortable with running queries in Bigquery SQL, you can do the same in the BigQuery console if you have enabled BigQuery in the Step-2
Log Router & Log Storage: To view/edit the above created Sink. Navigate to Log Router (https://console.cloud.google.com/logs/router)
Similarly to view the bucket details or to enable/disable BigQuery Analysis. Visit the Log Storage Section (https://console.cloud.google.com/logs/storage)
Clean Up
Once you collect enough log data for analysing the Firestore Data Access pattern, may be for 2–3 days. Turn off the Audit Logs to prevent huge Logging cost.
Navigate to IAM & Admin > Audit Logs. Find Access Approval & Firestore/Datastore API. De-Select Data Read & Data Write Log Types for both Service and Save.
Conclusion
By analyzing Firestore audit logs using Google Cloud Audit Logs and Log Analytics, you can gain valuable insights into your application’s data access patterns. Here are some key observations you can make:
- Identify frequently accessed collections and documents: Analyze the frequency of reads and writes to pinpoint frequently accessed collections and documents. This can help you optimize data access patterns and identify potential bottlenecks.
- Track app activity and user behavior: Monitor read and write operations initiated by specific user IDs. This can help you understand user behavior and identify any anomalies or suspicious activity.
- Debug query performance: Analyze query duration and throughput to identify slow-running queries or performance bottlenecks. This can help you optimize query structure and improve overall application performance.

We are happy to support your Google Cloud journey, contact us to see how we can answer your needs.

