About the customer
Since it was founded in 2012, OTA Insight’s vision is to provide user-friendly revenue management tools, the global leader in cloud-based hospitality business intelligence.
Since then, OTA Insight has won many industry awards and has been named UK’s 17th fastest-growing private technology company in The Sunday Times Fast Track Hiscox #TechTrack100. OTA Insight has grown to become the preferred revenue management solution for over 60,000 independent, local and global chain properties in more than 185 countries, supported by 450 stellar employees.

The Challenge
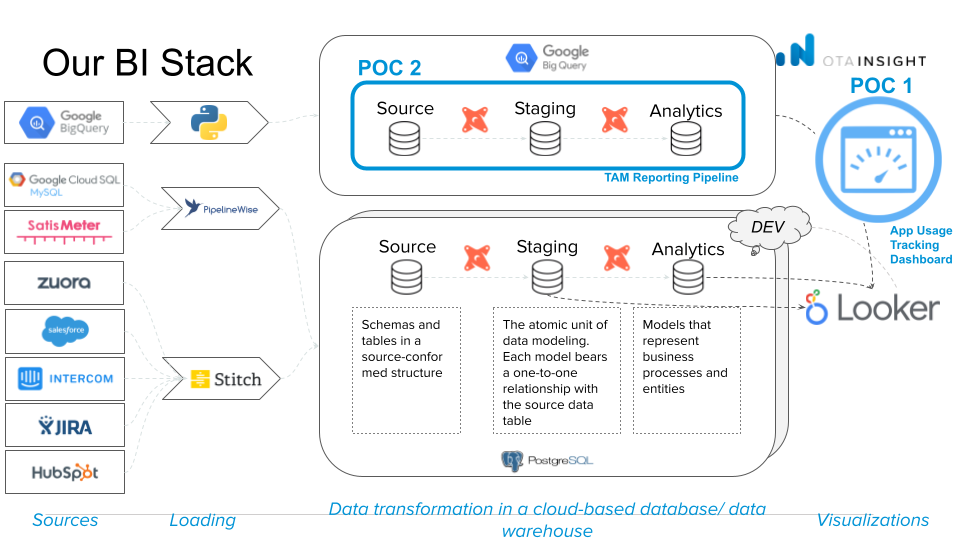
OTA’s data is stored across multiple platforms, some in BigQuery and some in their Data Warehouse in Postgres. The Postgres tables are being dumped into BigQuery by a scheduled jobbut the Looker dashboards built on this configuration experience slower performance. This has led to some concerns among OTA’s Sales, Account Management, and Finance teams.
The Goal
Devoteam G Cloud suggested 2 POCs to help OTA Insight in improving their current setup.
- POC 1: Performance audit of the current set-up
For those use cases or dashboards for which OTA insight is already leveraging BigQuery but is still unsatisfied with the performance, Devoteam suggested to conduct an audit of the current setup and to propose and implement some optimizations.
The objective was to improve the performance of a Looker Dashboard that was initially running on top of Postgres but had been moved by the team to BigQuery, and yet was still too slow. We were brought in to assess the dashboard’s speed and optimize it, with a focus on one specific dashboard for the proof of concept.
- POC 2: Migrating PostgreSQL databases to BigQuery
As OTA Insight has most of its Data Warehouse stored in a PostgreSQL database on Google Cloud SQL, this setup has limited options to properly scale for their analytical needs. That’s why OTA insight looked into migrating the data to BigQuery. This 2nd POC was ideal to gauge the effort and feasibility of such a migration towards BigQuery, that would give them the possibility to leverage the serverless architecture, as well as the seamless horizontal scalability. Next to that, it has an optimised integration with Looker, which makes it possible to leverage features such as BigQuery BI Engine to increase the performance even more.
- Additional goal: knowledge sharing between experts
As these were 2 relatively small POCs with a limited scope, the goal of the project was also to share knowledge with the OTA Insight team so that they could continue the migration and optimisation work on their side after the POCs.

The Solution & Methodology
- POC 1: Performance audit of the current set-up
The methodology used to optimize the dashboard involved several steps. Firstly, an analysis was conducted to identify the slow parts of the dashboard. This was done by using the built-in Database Performance dashboard from Looker, which provided an overview of the dashboard’s performance and highlighted any slow queries.
Next, the team examined the dashboard itself to identify which tiles corresponded to the slow queries. This allowed the team to determine which areas needed to be optimized.
From the analysis it was found that the primary cause of the slow queries was joining 5-6 different tables. The chosen strategy to improve the dashboard’s performance was to pre-join the tables into one table, so that the expensive join calculations did not need to be done every time the dashboard was loaded. This significantly improved performance and the amount of data being queried.
The team used aggregate tables to perform the joining, which is a built-in feature in Looker. These tables have two main benefits:
- First, as a special type of persistent derived tables, they enable upfront joining, as described above.
- Second, they allow for the use of “aggregate awareness,” which lets Looker improve performance by finding the smallest, most efficient table available in your database to run a query while still maintaining accuracy.
Overall, this methodology resulted in a significant improvement in dashboard performance, with faster load times and more efficient queries.
- POC 2: Migrating Data pipeline running in PostgreSQL to BigQuery
For the Second POC, we had to migrate a DBT pipeline running on Postgres to run on BigQuery. The team faced a challenge when they realized that the queries needed to be translated from PostgreSQL to BigQuery SQL, with additional best practices to improve performance.
To address this challenge, the team took several steps. First, they translated the PostgreSQL specific code to BigQuery SQL, which sometimes involved a significant change in the way the code was written, as BigQuery requires optimal queries to achieve optimal performance. By optimizing the queries, the team was able to achieve significant improvements in performance.
When the team initially ran the queries, they took 10 to 15 minutes to complete. However, this was not an acceptable result for queries running in BigQuery. To address this, the team focused on optimizing the code, so that it would run in just a few seconds. This was achieved by following best practices and writing optimal queries for BigQuery.

What OTA Insight valued the most about Devoteam was their ability to provide a comprehensive overview of the tools and pipeline required to develop a new version of their data warehouse. Within OTA Insight this knowledge is scattered throughout different teams, Devoteam’s expertise extends beyond specific applications like BigQuery, DBT, or Looker, enabling them to offer a broader perspective. Devoteam’s ability to bring this comprehensive view to OTA Insight was greatly appreciated.
The Result
- POC 1: Performance audit of the current set-up
The outcome of POC 1, which was a performance audit of the current set-up, involved identifying the slowest tiles on the dashboard and focusing on them.
The first method of aggregated tables, reduced the cloud spending by decreasing the execution time and lowering the amount of data to read as indicated in the examples below:
Tile 1: Time on site (TOS) per tab (per min)
- Execution time: 16.8s → 5.0s
- Amount of data read: 327 MB → 101 MB
Tile 2: Time on site (TOS) Overview
- Execution time: 26.4s → 5.7s
- Amount of data read: 1.53 GB → 790 MB
The team experimented with a second approach using BI Engine, a component of BigQuery that is billed based on slot time consumption. This method proved to be more cost-effective than the initial setup, though slightly costlier than utilizing derived tables. The team concluded that both methods were effective, but it is advisable to begin with the first method (Persistent Derived Tables).
- POC 2: Migrating Data pipeline running in PostgreSQL to BigQuery
The second proof of concept (POC 2) aimed to demonstrate the ability to migrate a data pipeline from Postgres to BigQuery. The primary objective was to showcase the feasibility of this migration for all pipelines, with performance improvement being a secondary consideration. The result was a functional pipeline, with a runtime of approximately 2.5 minutes, in contrast to the original Postgres pipeline where the two most resource-intensive queries each took over 50 minutes. This illustrated that a successful migration to BigQuery was achievable, while also improving performance.

The project served as a valuable proof of concept, providing our organization with a comprehensive understanding of the resources needed for a successful migration to BigQuery, as well as guidance on how to best prepare for such a transition

Is your Looker Dashboard Running Slow?
If you’re struggling with slow performance issues on your Looker dashboard, you’re not alone. But the good news is, there’s a potential solution that can help you achieve faster processing speeds and cost savings on infrastructure spend.
Shall we meet and talk about your challenges? Maybe a performance audit, similar to OTA Insight’s, could be the ideal solution for you.
